Facts on Housing Affordability in Australia
Did you know….
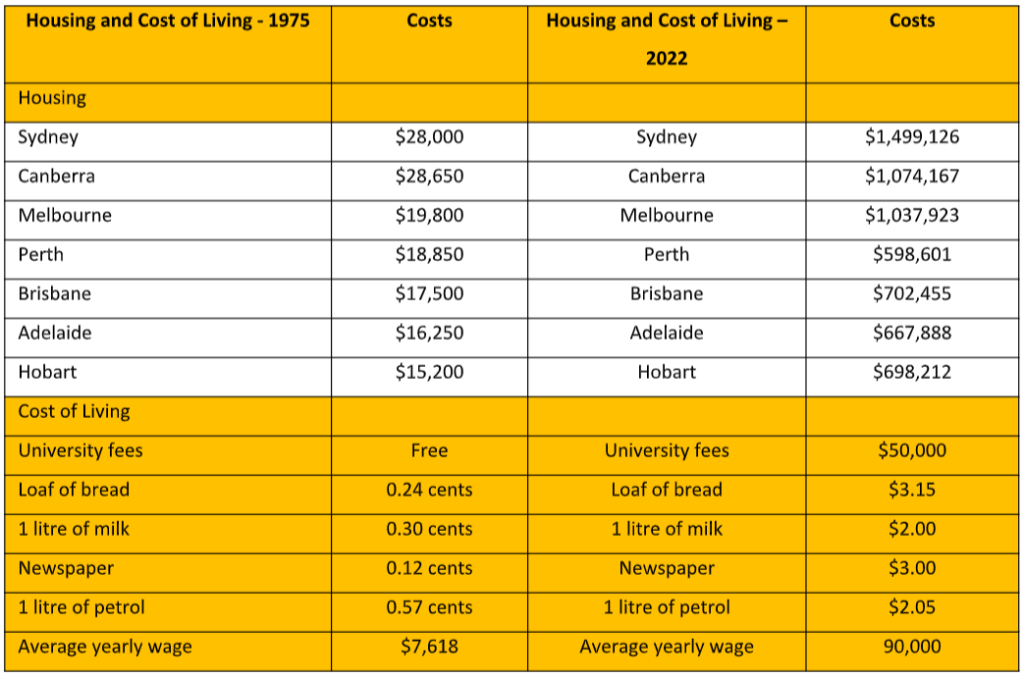
- The Housing Affordability crisis in Australia reflects the situation where the growth in house prices in Australia’s major cities have vastly exceeded the growth in personal income, making housing ownership an unattainable goal for many Australians’. In Sydney for example, the median house price (2022) is $1.5m but the average income is only $90,000, meaning the median house price is equivelant to 16 years gross wages.Up until the 1970’s this ratio was 4 years wages to the median house price.
- In 1975 a standard suburban home in Sydney cost $28,000. Today it is valued at over $1.5m.
- Of the top 20 most unaffordable cities in the world, there are 5 Australian Cities – Sydney (2), Melbourne (5), Adelaide (16), Brisbane (18), Perth (20).
- Generation Z (born post 1997) may be the first generation since before the Second World War that will be unable to afford a house in cities such as Sydney, Melbourne, Canberra and Brisbane where the Median house price is about to or has exceeded $1m.
- The Housing and cost of living – 1975 versus 2022:

The term ‘mortgage stress’ is relatively new, appearing in the early 2000’s to describe households that where under mortgage pressure. The term refers to the portion of disposable income devoted to servicing a mortgage; once this portion reaches a third of disposable income, the household is under financial stress. Put simply: if mortgage servicing exceeds a third of a household’s income, there is less money available for other essential items, such as education, food and bills.
- Approximately 1 in 7 households – 1,400,000 households across Australia are under ‘mortgage stress’.
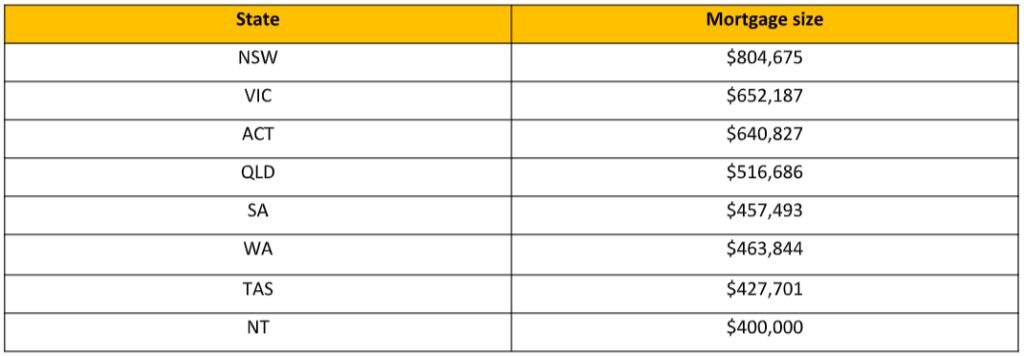
- The average mortgage across Australia in 1993 was $100,000. By 2022 this has increased to $618,000. New South Wales has the highest average mortgage of $804,000. See results for across Australia below:

- Home Ownership in Australia ‘peaked’ in 1975 with owner occupiers accounting for 72% of all housing in Australia. A further 18% of housing was social housing and the remaining 10% private rental housing.
- Home Ownership today has declined with owner occupier accounting for 60% of all households. Social housing has also declined to just 9% of all households. The biggest increase has been in private rental housing, increasing to 31% of all households. There are now 2.2m Australians which own private rental properties in Australia.
- There is over 10.5m residential properties across Australia worth a staggering $7.1 trillion dollars. With the rise of private rental property, ‘housing wealth’ is now increasingly concentrated in the hands of fewer people.
- Negative gearing came about through a tax ruling in 1985. It enables property owners who are running at a loss to be able to offset that loss against other income earnt, such as wages for the average worker.
- Negative gearing encouraged property investment which brought owner occupiers in direct competition with property investors driving up house prices.
- In 2022 negative gearing cost the Federal Government over $18 billion dollars in tax. This means the Government will need to find an addition $18 billion dollars in tax somewhere else in the economy to plug the tax hole.
- Negative gearing isn’t the only factor influencing housing costs in Australia. Since the 1950’s household sizes have grown from a modest average of 100sqm in area to 240sqm in area by 2022. At the same time the average household size has been declining from 3.5 persons per household in the 1950’s to 2.5 persons per household in 2022.
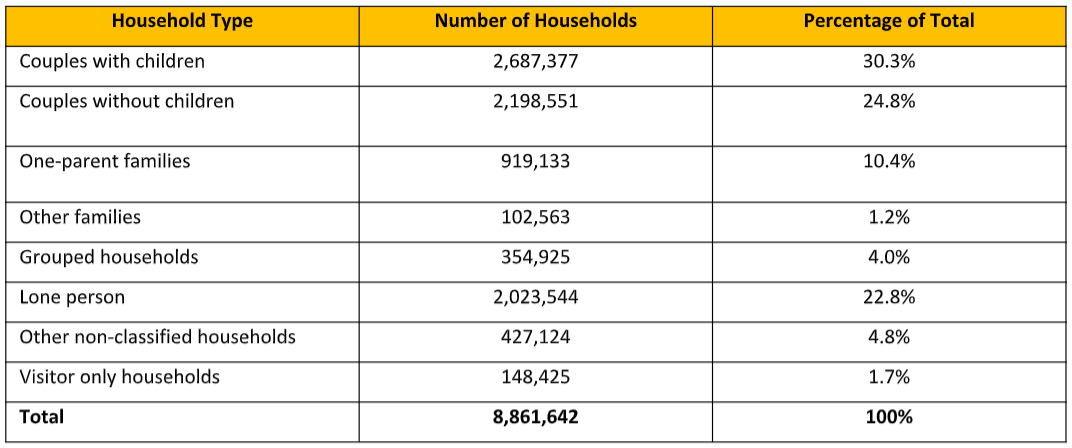
The composition of Australian households is detailed below:

The composition of housing type is below:


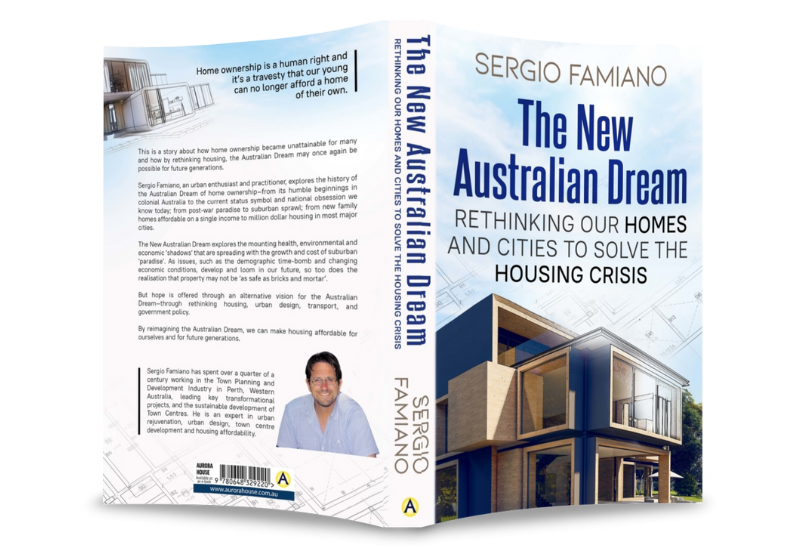
The New Australian Dream
Rethinking our Homes and Cities to Solve the Housing Crisis
